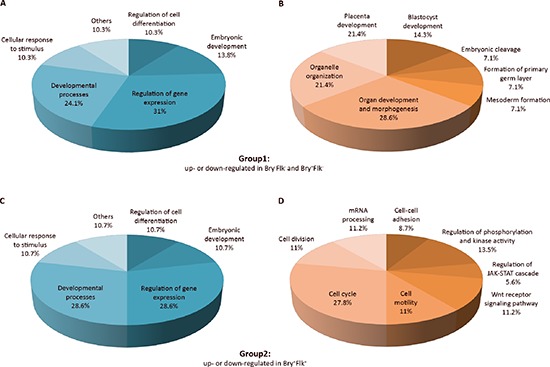
Figure 2. Biological classification of differentially regulated phosphopeptides.

Pie chart representation of the phosphopeptide-emanated proteins classified into groups by Biological process. Phosphopeptides from Group 1 (up- or down-regulated in Bry−Flk1− and Bry+Flk1−) and Group 2 (up- or down-regulated in Bry+Flk1+) were considered as they are indicative for the regulation of stem cell differentiation. The relative frequency of over-represented categories is reported as percentage in the pie charts. (A) and (C) Biological processes of phosphopeptides differentially regulated both in Group 1 and Group 2, respectively. (B) and (D) Biological processes specific to phosphopeptides differentially regulated either in Group 1 or Group 2. Gene Ontology classification was performed using the plugin BiNGO v2.42 within Cytoscape v.2.8.2, assessing over-represented categories with a hypergeometric statistical test and Benjamini & Hochberg False Discovery Rate correction (p < 0.05). As a reference set, the whole mouse repository annotation was used.
