
Figure 4. Microsphere morphology and structure during degradation in PBS (pH 7.4) BSA 1% (w/v) at 37°C.
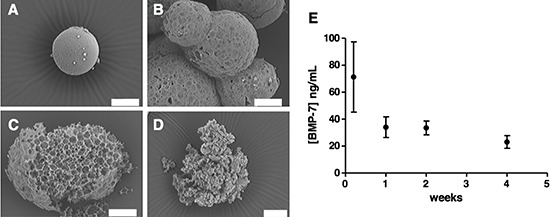
Images taken at the starting point of the experiment (A), after 1 week (B), 2 weeks (C) and 4 weeks (D). (E) BMP7 concentration released at these time points (distributive data) was measured by ELISA.