
Figure 6. BMP signaling and gene expression analysis of the GBM xenografts.
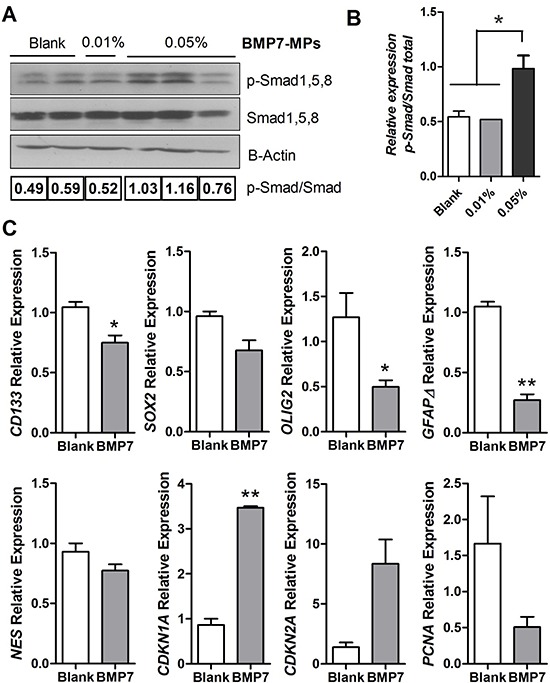
(A) Western blot analysis of p-Smad1, 5, 8 and total Smad1, 5, 8 in the tumors at the end of the experiment. β-actin was used as the loading control. (B) Western blot quantification, the amount of p-Smad1, 5, 8 is shown relative to the amount of total-Smad1, 5, 8. n = 3 independent tumors. (C) CD133, SOX2, OLIG2, GFAPδ, NESTIN, and CDKN1A, CDKN2A and PCNA relative mRNA expression levels of the tumor tissue. GAPDH was used as the RTqPCR housekeeping gene. n = 3 independent tumors. *p < 0.05, **p < 0.01.