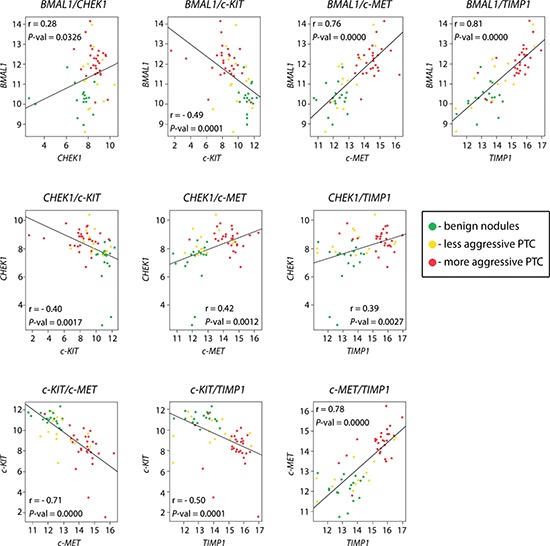
Figure 1. Pair-wise correlations between BMAL1, CHEK1, TIMP1, c-KIT and c-MET transcript changes in PTC.

Pearson correlation analysis revealed pair-wise correlations of gene expression in PTC (combined samples from 1st and 2nd cohorts, Tables 1 and 2) and benign (1st cohort, Table 1) samples. The correlation strength was based on Evans classification (see Methods for details), with a coefficient r value < 0.20 reflecting very weak correlation; 0.20 – 0.39 – weak; 0.40 – 0.59 – moderate; 0.60 – 0.79 – strong; and > 0.80 - very strong. The dots at each graph are representing normalized respective gene expression values.
