
Figure 1. Tumor growth of LLC cells was inhibited in the presence of LRG in vivo.
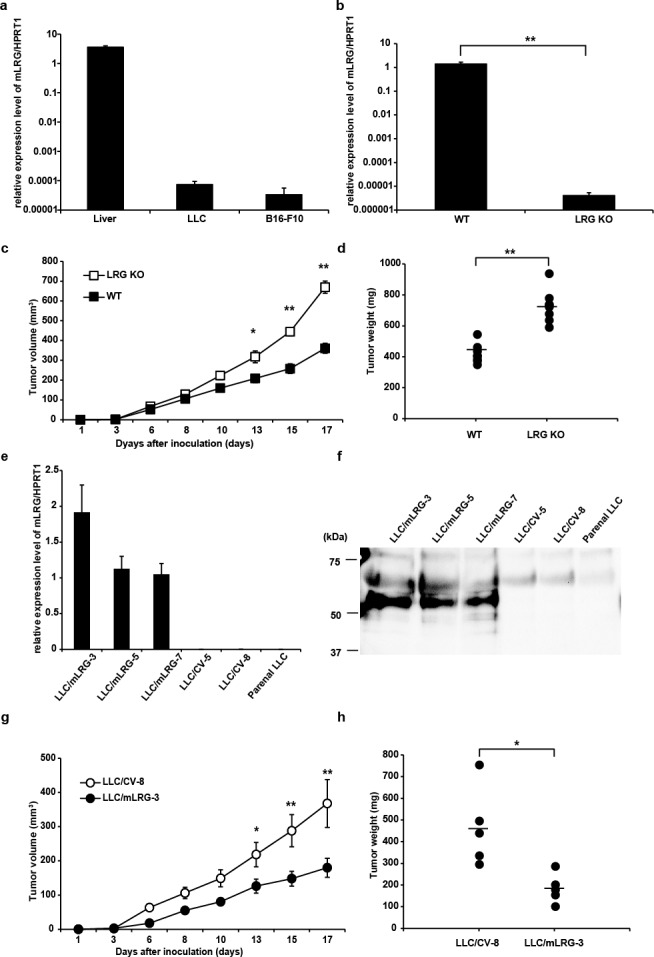
a. Quantitative real-time PCR analysis of mLRG mRNA expression in mouse liver, LLC cells, and B16-F10 cells. Quantitative real-time PCR threshold values for target genes were normalized against the level of HPRT1. b. Quantitative real-time PCR analysis of mLRG mRNA expression in the LLC tissue of WT and LRG KO mice. Quantitative real-time PCR threshold values for target genes were normalized against the level of HPRT1. Each value is the average ± standard deviation. c. Tumor growth curves of LLC cells on subcutaneous injection into LRG KO mice or WT C57BL/6J mice (n = 8 for each group). d. Tumor weight on day 17 after implantation of LLC cells (n = 8). Data are presented as mean ± standard error of the mean. e,f. Western blot analysis of mLRG expression in the supernatant and quantitative real-time PCR analysis of mLRG mRNA levels in mLRG-overexpressing LLC clones (LLC/mLRG-3,5,7), control vector LLC clones (LLC/CV-5,8) and parental LLC cells. Quantitative real-time PCR threshold values for target genes were normalized against the level of HPRT1. Each value is the average ± standard deviation. g. Growth curves of control vector LLC (LLC/CV-8) and mLRG-overexpressing LLC (LLC/mLRG-3) cells implanted in WT C57BL/6J mice (n = 5 for each group). h. Tumor weight on day 17 after implantation of LLC/mLRG-3 and LLC/CV-8 cells (n = 5). Data are presented as mean ± standard error of the mean. * P < 0.05, **P < 0.01.