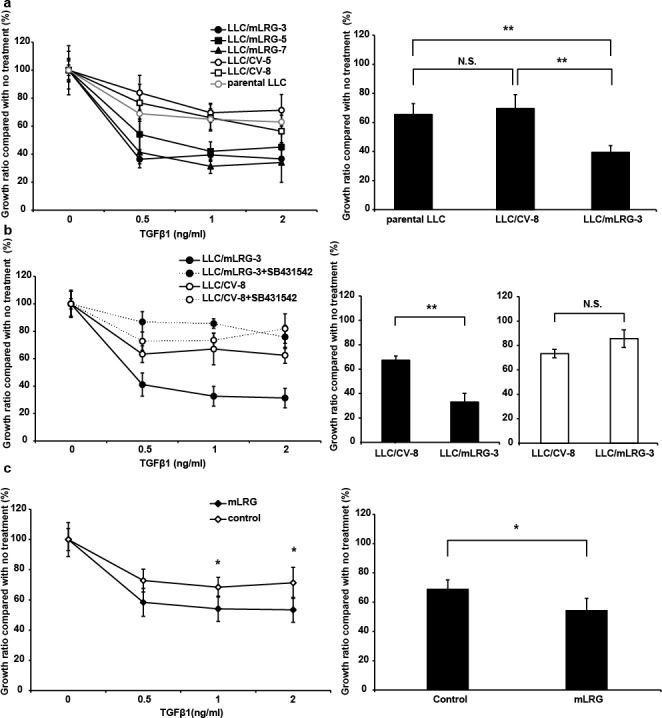
Figure 2. TGFβ1 inhibited the proliferation of mLRG-overexpressing LLC cells more effectively than that of control vector LLC cells.

a. The left panel shows the growth curves of mLRG-overexpressing LLC (LLC/mLRG-3,5,7), control vector LLC (LLC/CV-5,8), and parental LLC cells treated with TGFβ1. Cells were cultivated in the presence of TGFβ1 (0–2 ng/mL). After culture for 72 h, viable cell numbers were counted using the WST-8 assay. The right panel shows the viability of LLC/mLRG-3, LLC/CV-8, and parental LLC cells after treatment with 1.0 ng/mL of TGFβ1 for 72 h. b. The left panel shows the growth curves of mLRG-overexpressing LLC (LLC/mLRG-3) and control vector LLC (LLC/CV-8) cells treated with TGFβ1 and TGFβR1 inhibitor. Cells were cultured in the presence of TGFβ1 (0–2 ng/mL) with DMSO or a TGFβR1 inhibitor, SB431542 (10 μM). After culture for 72 h, viable cell numbers were counted using the WST-8 assay. The right panel shows the viability of LLC/mLRG-3 and LLC/CV-8 cells after treatment with 1.0 ng/mL of TGFβ1 with (black bar) or without (white bar) SB431542 (10 μM) for 72 h. c. The left panel shows the growth curves of parental LLC cells treated with TGFβ1 (0–2 ng/mL) combined with recombinant mLRG (10 μg/mL) from LLC/mLRG-3 cells or purified products from LLC/CV-8 cells. After culture for 72 h, viable cell numbers were counted using the WST-8 assay. Each value is the average ± standard deviation. The right panel shows the viability of parental LLC cells after treatment with 1.0 ng/mL of TGFβ1 for 72 h. Each value is the average ± standard deviation. * P < 0.05, **P < 0.01.
