
Figure 5. Genes with EGR1 transcription factor binding sites are enriched in Eμ-Myc driven tumors with miR-146a deficiency.
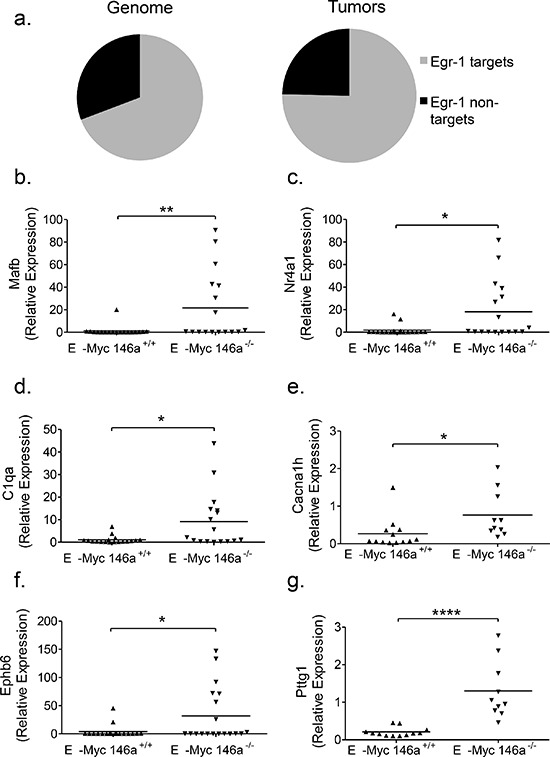
a. Graphical representation of the percentage of the genome (left) containing EGR1 TFBS (11136 TFBS out of 16288 genes that were conserved between human and mouse), compared with the percentage of differentially regulated genes in the tumor dataset (right) that show EGR1 TFBS (153 with TFBS out of 203 differentially regulated genes that are conserved between mouse and human). This difference was found to be statistically significant (Chi-square test, one-sided p = 0.0353). b–g. RT-qPCR confirmation of differentially regulated genes that show EGR1 TFBS, including Mafb (b; t-test, p = 0.0093), Nr4a1 (c, t-test, p = 0.0126), C1qa (d; t-test, p = .0101), Cacna1 h (e; t-test, p =.0308), Ephb6 (f; t-test, p = .0248), Pttg1 (g; t-test, p < 0.0001). For these RT-qPCR analyses, n = 18 for Eμ-Myc miR-146a+/+ and n = 17 for Eμ-Myc miR-146a−/−.