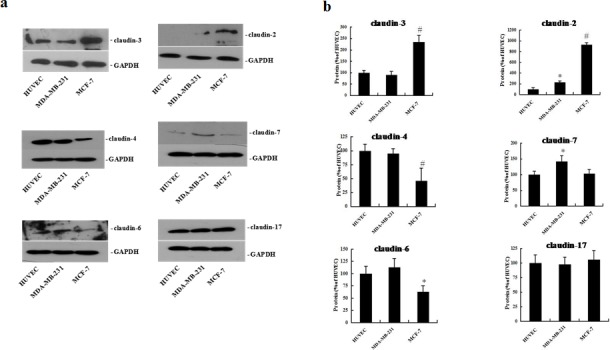
Figure 2. Expression of claudin-2, -3, -4, -6, -7, and -17 proteins in HUVEC, MDA-MB-231, and MCF-7 cells.

HUVEC, MDA-MB-231, and MCF-7 cells were plated on matrigel for 72 h. Western blot analysis of claudin proteins was performed using whole cell protein lysate. (a) Representative blots of claudin-2, -3, -4, -6, -7, and -17 (b) The corresponding expression levels are shown as bar graphs. Claudin protein levels in HUVEC cells were defined as 1. Data represent the mean + SD (n=3), *: p < 0.05 compared with HUVEC cells. #: p < 0.01 compared with HUVEC cells.
