
Figure 5. Analysis of vascular channel formation following stable transfection of MCF-7 cells with pEGFP-N1-CLDN4.
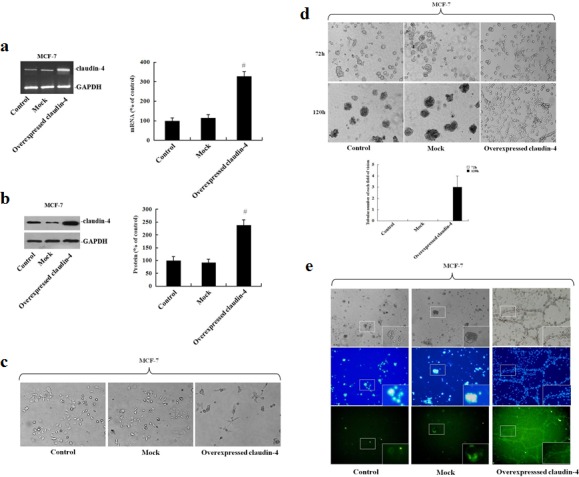
MCF-7 cells were stably transfected with pEGFP-N1-CLDN4. Cells were selected in the presence of G418 (200 μg/mL) and clonal cell lines were established. (a) Clones were maintained in medium containing G418 and screened for claudin-4 overexpression by RT-PCR. Claudin-4 mRNA levels were assessed by densitometry and normalized to GAPDH. Changes are expressed as a percentage of the control. #: p < 0.01 compared with controls. (b) Claudin-4 protein levels were assessed by western blot and quantification is represented in bar graphs. Defined claudin-4 protein of the control group as 1, other groups compared with it. Data represent the mean + SD (n=3). #: p < 0.01 compared with controls. (c) Morphological characteristics of MCF-7 cells were visualized by phase-contrast microscopy. (d) Changes in vascular channel formation in MCF-7 cells. MCF-7 cells were plated on matrigel, and images were acquired by phase-contrast microscopy at the times indicated. (e) Representative confocal images of non-transfected, transfected blank vector and stably transfected MCF-7 cells. Following fixation, cells were stained with a claudin-4 antibody (green) and DAPI (blue).