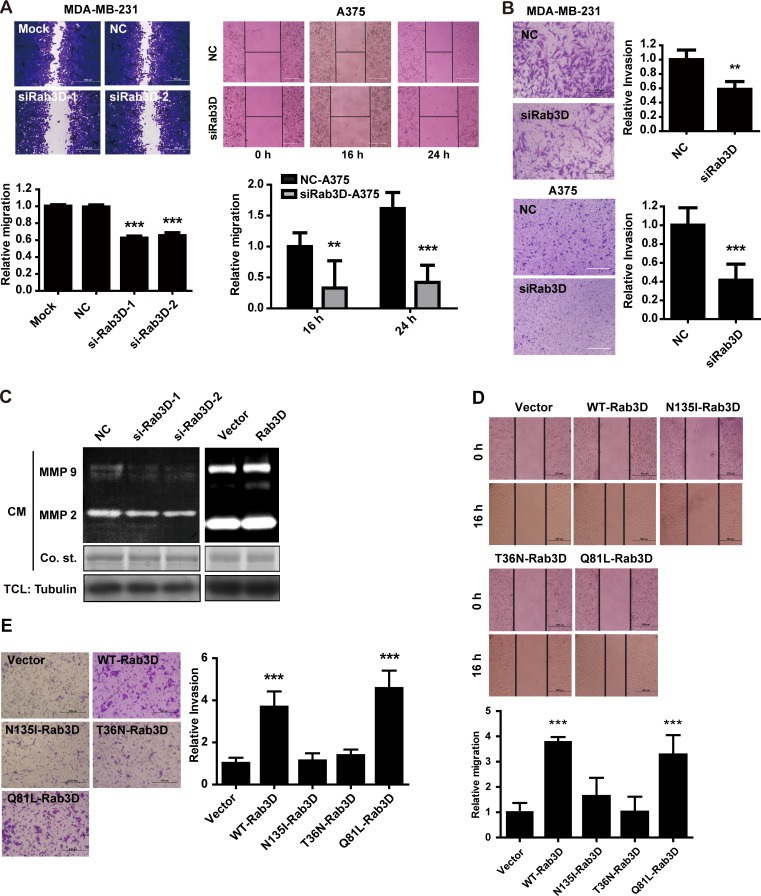
Figure 3. The effect of Rab3D on tumor cell migration and invasion in vitro.
(A). Down-regulation of Rab3D markedly repressed tumor cells migration (wound healing assays). Representative images and quantification of migration assay in Rab3D knockdown MDA-MB-231 cells (Scale bar, 200 μm) or A375 cells (Scale bar, 50 μm). ** p < 0.01, *** p < 0.001. (B). Down-regulation of Rab3D inhibited the invasion capability of tumor cells on Matrigel-coated transwell insets in the invasion assay. Representative images and quantification of invasion assay by MDA-MB-231 cells (Scale bar, 100 μm) or A375 cells (Scale bar, 50 μm) in which Rab3D was depleted. ** p < 0.01, *** p < 0.001. (C). The effect of Rab3D on MMP-2 and MMP-9 activity. Gelatin zymography analysis of MMP-2 and MMP-9 activity in CM from Rab3D knockdown MDA-MB-231 cells or Rab3D overexpressing MCF-7 cells. (D). Representative images and quantification of migration assay by MCF-7 cells transfected to express Rab3D mutation. Scale bar, 200 μm. *** p < 0.001. (E). Representative images and quantification of the invasive phenotype. Scale bar, 100 μm. ***p < 0.001.

