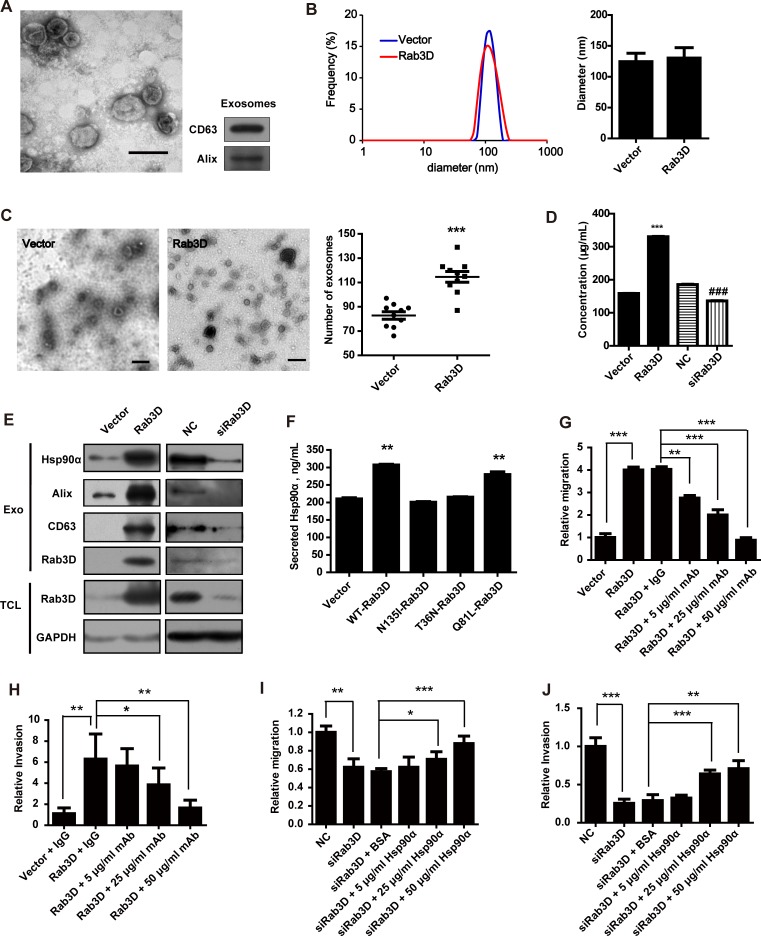
Figure 5. The role of secreted Hsp90α in Rab3D induced invasion.
(A). Identification and characterization of exosomes. Exosomes were isolated by sequential centrifugations from supernatants. Scale bar, 100 nm. An inset panel shows the exosomal marker, tetraspanin protein CD63 and Alix by Western Blot. (B). The size distribution of exosomes was analyzed by DLS and given as average ± standard deviation (n = 3). (C). Representative images and quantification of exosomes. Scale bar, 200 nm. *** p < 0.001. (D). The total protein level of extracellular exosomes was detected by BCA (n = 3). (E). Western Blot analysis of exosomal marker CD63 and Alix in exosomes from Rab3D-MCF-7 cells or siRab3D-MDA-MB-231 cells. (F) The level of secreted Hsp90α was detected by ELISA assay when the MCF-7 cells were transfected with different plasmid. (G). Quantification of migration assay of recombinant Hsp90α treated MDA-MB-231 transfected with scramble RNA or Rab3D siRNA. Statistically significant p values are indicated. ** p < 0.01, *** p < 0.001. (H). Measurement of invasion in siRab3D MDA-MB-231 with or without addition of recombinant Hsp90α. * p < 0.05, ** p < 0.01, *** p < 0.001. (I). Quantification of migration assay. MCF-7 cells that expressed Rab3D, with or without Hsp90α neutralizing antibody, were seeded. The relative migration distance was calculated after 16 h. * p < 0.05, ** p < 0.01, *** p < 0.001. (J). Quantification of matrigel invasion assay. The effect of blocking extracellular Hsp90α in MCF-7 cells over-expressing Rab3D on invasive ability. ** p < 0.01, *** p < 0.001.

