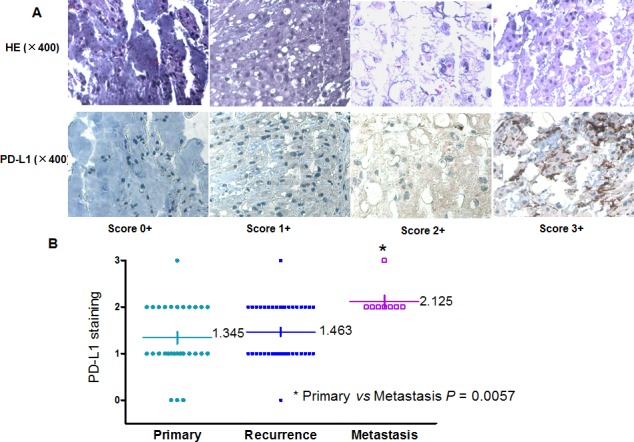
Figure 2. Association of PD-L1 expression with clinical outcome in chordoma.

(A) Representative images of different IHC staining intensities of PD-L1 and HE staining were shown in the chordoma TMA. (B) Distribution of PD-L1 staining scores among primary, recurrent, and metastatic tumor tissues. The median PD-L1 expression score for metastatic status (2.215) was significantly higher compared with primary status (P = 0.0057).
