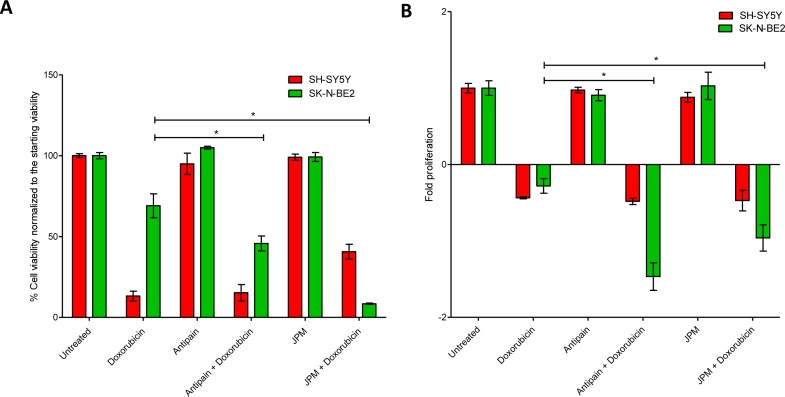
Figure 4. Treatment of neuroblastoma cells with cathepsin inhibitors and doxorubicin.
(A) Cell viability analysed with propidium iodide uptake and annexin V-FITC staining. Error bars represent standard error of the mean, n=3, * denotes significance (p<0.05). (B) Cell proliferation analysis of neuroblastoma cells treated with doxorubicin in the presence and absence of cathepsin inhibitors. Error bars represent standard error of the mean, n=12, * denotes significance (p<0.05). Student's t-test was used to evaluate statistically significant differences between the values.

