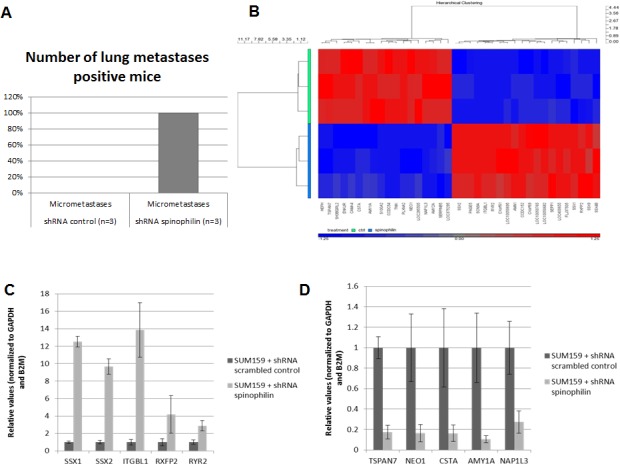
Figure 4. In vivo metastases formation and gene expression profile in spinophilin-silenced basal-like breast cancer cells.

(A) Shows the number of mice positively explored for lung micrometastases in the SUM159 xenografts (B): HeatMap of the top differentially expressed genes of SUM159 with silenced spinophilin compared to control cells. Genes clustered using hierarchical clustering (Pearson's dissimilarity, Ward’ method) on expression values present in picture. Genes shifted to mean of zero and scaled to standard deviation of one. Five up- (C) and five down-regulated genes (D) were selected and validated by qRT-PCR.
