
Figure 5. Effect of Sunitinib on HIF pathway during CSC endothelial differentiation.
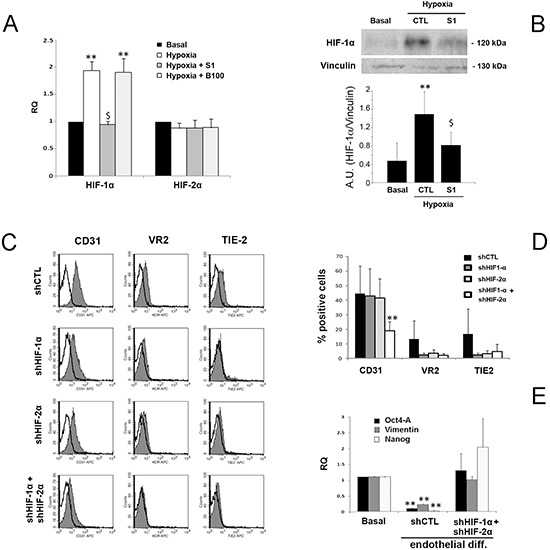
Panel A. Quantitative RT-PCR analysis showing the increase of HIF-1 alpha but not of HIF-2 alpha by B-CSC incubated for 3 hours in endothelial-differentiating condition in hypoxia in the presence and absence of 1 μM Sunitinib (S1) or 100 μg/ml Bevacizumab (B100). Data were normalized to GAPDH mRNA and to 1 for time 0, expressed as relative quantification (RQ) and are mean ± SD of three different experiments. Student's t test was performed: **= p < 0.001 vs Basal; $= p < 0.001 vs Hypoxia. Panel B. Western blot micrograph and densitometric analysis of HIF-1 alpha expression. Data, shown as arbitrary units, are representative of three different experiments and were normalized to vinculin expression. Student's t test was performed: **= p < 0.001 vs Basal; $= p < 0.001 vs CTL. Panel C and D. Expression of endothelial differentiation markers by control B-CSC infected with a scramble shRNA (shCTL) and in B-CSC lacking HIF-1 alpha (shHIF-1α), HIF-2 alpha (shHIF-2α) or both (shHIF-1α+shHIF-2α). In the representative FACS analyses, the gray filled area shows binding of the specific antibody and the dark line the isotypic control (C). In the histogram, the percentage of expression is reported (D). Data are mean ± SD of five different experiments. Student's t test was performed: **= p < 0.001 vs shCTL. Panel E. Quantitative RT-PCR analysis showing the reduction of the stem-cell associated markers Oct4-A, Vimentin and Nanog in shCTL cells after endothelial differentiation in respect to basal condition, but not in endothelial differentiated shHIF-1α+shHIF-2α cells. Data were normalized to GAPDH mRNA and to 1 for time 0 and expressed as relative quantification (RQ). Data are mean ± SD of three different experiments. Student's t test was performed: **= p < 0.001 vs Basal.