
Figure 1. VM in human gastric cancer (GC) tissues and its relation with the clinical outcome.
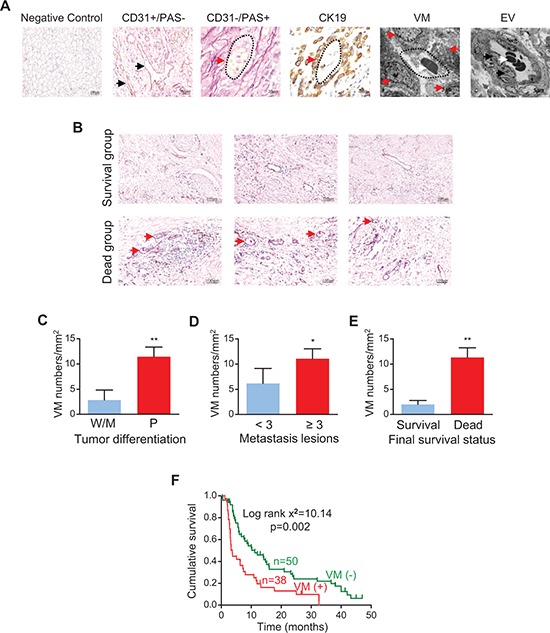
(A) Representative pictures of vessels formed in GC tissues by endothelium-dependent angiogenesis and structures formed by vasculogenic mimicry (VM), which were confirmed by CD31/PAS staining and transmission electron microscopy (TEM). Negative control is indicated in panel 1. CD31-positive structures (brown color, indicated by black arrows in panel 2) are vessels with an endothelial lining, while PAS-positive networks are VM channels lined by tumor cells (pink color, indicated by red arrow in panel 3). CK19-positive staining shows VM is surrounded by tumor cells (brown color, indicated by red arrows in panel 4). Panels 5 and 6 show VM structure (red arrows) and endothelial cells of a blood vessel (black arrows) by TEM, respectively; several blood cells (white arrows) are surrounded by a complete vessel wall. Original magnification: × 200 (panel 1); × 400 (panel 2); × 1000 (panels 3 and 4); × 8000 (panel 5); × 5000 (panel 6). (B) Representative photomicrographs showing VM density in survivors and non-survivors. (C–E) VM density in GC patients stratified by tumor differentiation [W, well differentiated; M, moderately differentiated; P, poorly differentiated (C)], metastasis (D), and survival (E). *p < 0.05; **p < 0.01 versus the corresponding control group, n = 14 and n = 74 for the W/M group and P group, respectively; n = 18 and n = 70 for < 3 and ≥ 3 metastasis lesions, respectively; n = 12 and n = 76 for survivors and non-survivors, respectively. (F) Kaplan-Meier plot showing the influence of VM density on the survival of patients with stage IV GC.