
Figure 3. MACC1 promotes VM in vivo and in vitro.
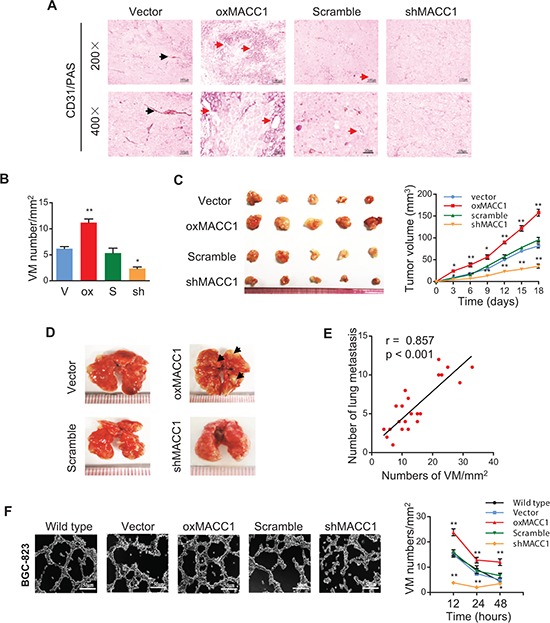
(A) Representative CD31/PAS stained images of tumor sections from GC xenografts with overexpression or silencing of MACC1 (oxMACC1 and shMACC1) and their corresponding controls. Red arrows indicate a typical VM structure. Black arrows indicate a endothelial vessel. (B) Quantitation of VM density in GC xenografts shows that it is higher in the MACC1-overexpressing group than in other groups. *p < 0.05; **p < 0.01, n = 6 vs. the corresponding control group. (C) Size (left panel) and tumor volume curves (right panel) of GC xenografts harvested at 18 days after inoculation. *p < 0.05; **p < 0.01, n = 6. (D) Metastases (black arrows) in the lungs at 40 days after inoculation. Metastases were frequent in the MACC1-overexpressing group, but were seldom detected in the MACC1-silenced group. (E) The VM density of xenograft GC tissues was positively correlated with the number of lung metastases (r = 0.857, p < 0.001; n = 6). (F) Representative VM images and quantitation of tube formation by BGC-823 GC cells after 3D culture for 12 hours. Scale bar = 50 μm. *p < 0.05; **p < 0.01, n = 3.