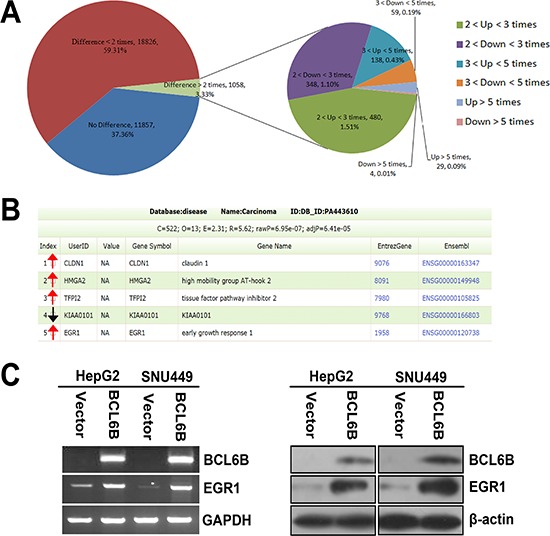
Figure 4. Differentially expressed genes in BCL6B re-expressed and unexpressed SNU449 cells analyzed by gene expression array.

A. The pie chart analysis for all 31741 probes in BCL6B re-expressed and unexpressed SNU449 cells. 167 genes were up regulated and 63 genes were down regulated for more than 3 times. B. HMGA2, CLDN1, TFPI2, KIAA0101 and EGR1 are cancer related genes according to Diseases Association Analysis. HMGA2, CLDN1, TFPI2 and EGR1 which are up-regulated for 5, 3.3, 3.7 and 31.4 times, and KIAA0101 is down-regulated for 3.2 times, respectively. (Red arrow stands for up-regulated and black arrow stands for down-regulated genes) C. The expression of EGR1 was validated by semi-quantitative RT-PCR and Western Blot in BCL6B unexpressed and re-expressed HepG2 and SNU449 cells.
