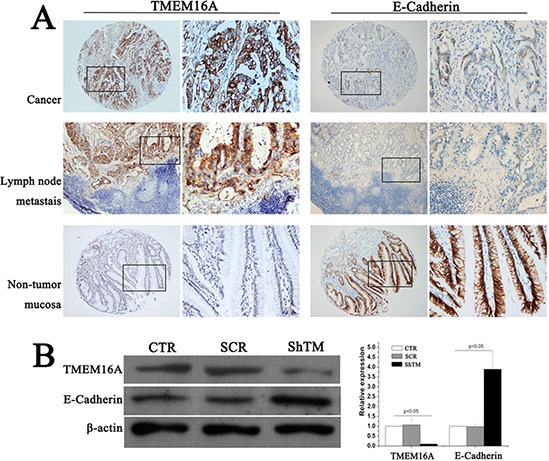
Figure 7. TMEM16A represses E-Cadherin expression.

A. Representative images of TMEM16A and E-cadherin immunostaining in gastric cancer, lymphnode metastasis lesion and non-tumor mucosal tissue (case 125). High expression of TMEM16A protein was detected in gastric cancer (n = 367) and lymphnode metastasis lesion (n = 30), and low expression was observed in non-tumor mucosal tissue (n = 20), but corresponding E-cadherin expression demonstrated the converse results. In panel TMEM16A and E-cadherin, the right panels displayed representative TMEM16A and E-cadherin proteins expression in selected zone with enlarged view. B. Knockdown TMEM16A upregulated E-cadherin expression in AGS cells by western blot analysis. Equal loading of protein was determined by β-actin (n = 6, p < 0.05).
