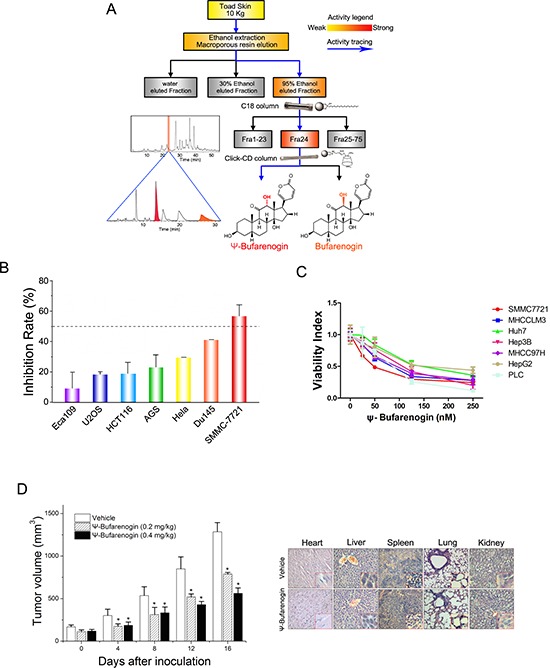
Figure 1. The therapeutic effect of ψ-Bufarenogin on liver cancer.

(A) A flow diagram of ψ-Bufarenogin isolation from toad skin using reversed-phase liquid chromatography coupled with hydrophilic interaction chromatography as previously described. (B) Seven cancer cell lines were exposed to 50 nM ψ-Bufarenogin for 48 hours. The cell viability was measured by CCK-8 assay and the inhibition rate was calculated. Data are represented as mean ± SEM. *p < 0.05. (C) Seven HCC cell lines were treated with 50 nM ψ-Bufarenogin for 48 hours followed by a cell viability assay. Data are represented as mean ± SEM. *p < 0.05. (D) SMMC-7721 cells-derived xenografts were implanted s.c. in the flanks of nude mice followed by i.v. administration of ψ-Bufarenogin. Tumor volume was monitored as described above (left). H&E staining of mice organs was performed after ψ-Bufarenogin therapy (right).
