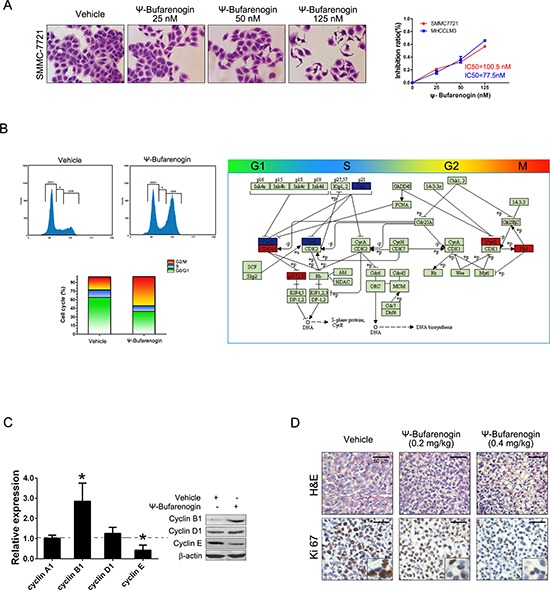
Figure 2. ψ-Bufarenogin suppresses hepatoma cells proliferation.

(A) SMMC-7721 and MHCC-LM3 cells were exposed to ψ-Bufarenogin at indicated dosages for 48 hours. CCK-8 assay was performed to calculate the inhibition rate and IC50. The cells were then stained with crystal violet and representative pictures were shown. (B) The cell cycle distribution of ψ-Bufarenogin-treated hepatoma cells was analyzed by flow cytometry (left). The differential expression of cell cycle-related genes in ψ-Bufarenogin-treated SMMC-7721 cells relative to control cells were achieved by Illumina microarray. Box in Red indicates upregulation and box in blue indicates downregulation (right). (C) The fold change of cyclin expression in ψ-Bufarenogin-treated SMMC-7721 cells relative to control cells was analyzed by real-time PCR. Western blot was conducted as described in Method. (D) The H&E staining and immunohistochemistry of Ki-67 antigen from xenografted hepatoma in mice treated with ψ-Bufarenogin (i.v.) as described above.
