
Figure 4.
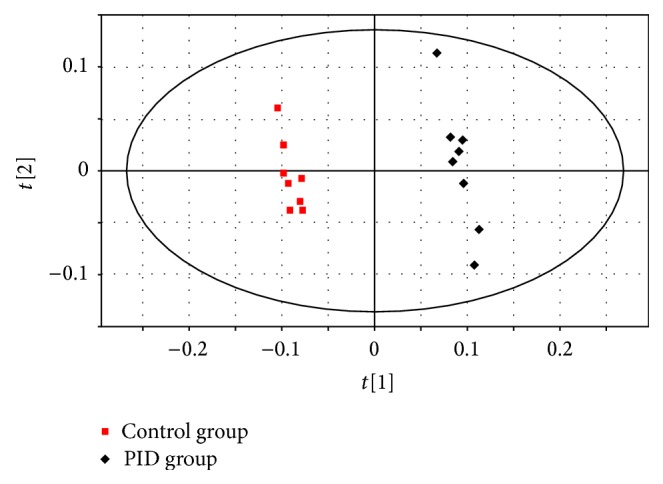
OPLS-DA scores plot based on the metabolomic data obtained from urine in control group and PID group (R2X = 0.605, R2Y = 0.996, Q2 = 0.978; n = 8). The red squares indicate control group, and the black diamonds indicate PID group.
Official websites use .gov
A
.gov website belongs to an official
government organization in the United States.
Secure .gov websites use HTTPS
A lock (
) or https:// means you've safely
connected to the .gov website. Share sensitive
information only on official, secure websites.
OPLS-DA scores plot based on the metabolomic data obtained from urine in control group and PID group (R2X = 0.605, R2Y = 0.996, Q2 = 0.978; n = 8). The red squares indicate control group, and the black diamonds indicate PID group.