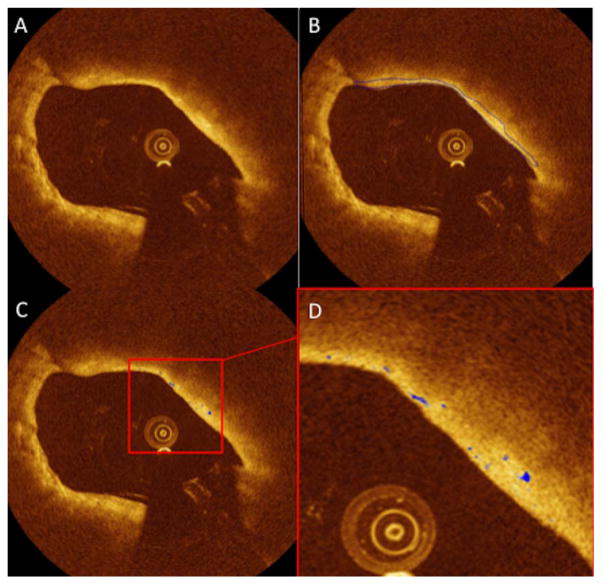
Fig. 1.
Illustration of FC segmentation and macrophage quantification performed on the same OCT cross-section, enabling the quantification of the thickness at each point of the FC as the surface area. A: Original image of a lipid-rich plaque with high signal attenuation of light; (B) Automated segmentation of FC; (C) Macrophage area (showed in blue); (D) Zoom highlighting the macrophage areas.

