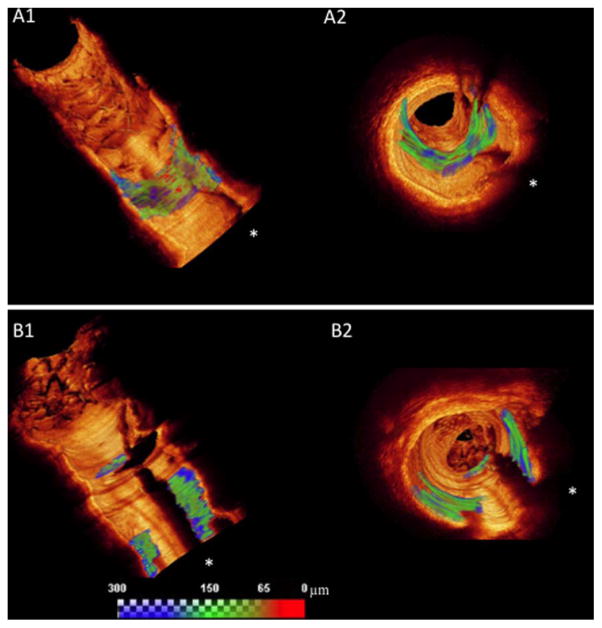
Fig. 2.
Representative cases of segmented FC in 3-D rendering with a continuous color map, from blue (>150 μm) to green (65–150 μm) to red (FC < 65 μm). Regardless of similar FC surface area, the morphological differences between the cases are easily demonstrated, as follows: the STEMI patient has a larger area of FC < 65 μm (red areas) than SAP patient. A1: Represents a longitudinal view of the ROI distal to the stented (white arrow) region showing FC area with TCFA; in (A2) a fly throw view of the same FC in the STEMI patient is depicted. B1: A longitudinal view of the ROI of SAP patient depicts FC area with TCFA, while (B2) shows a fly through view of the same FC. White asterisks represent guide wire shadow.

