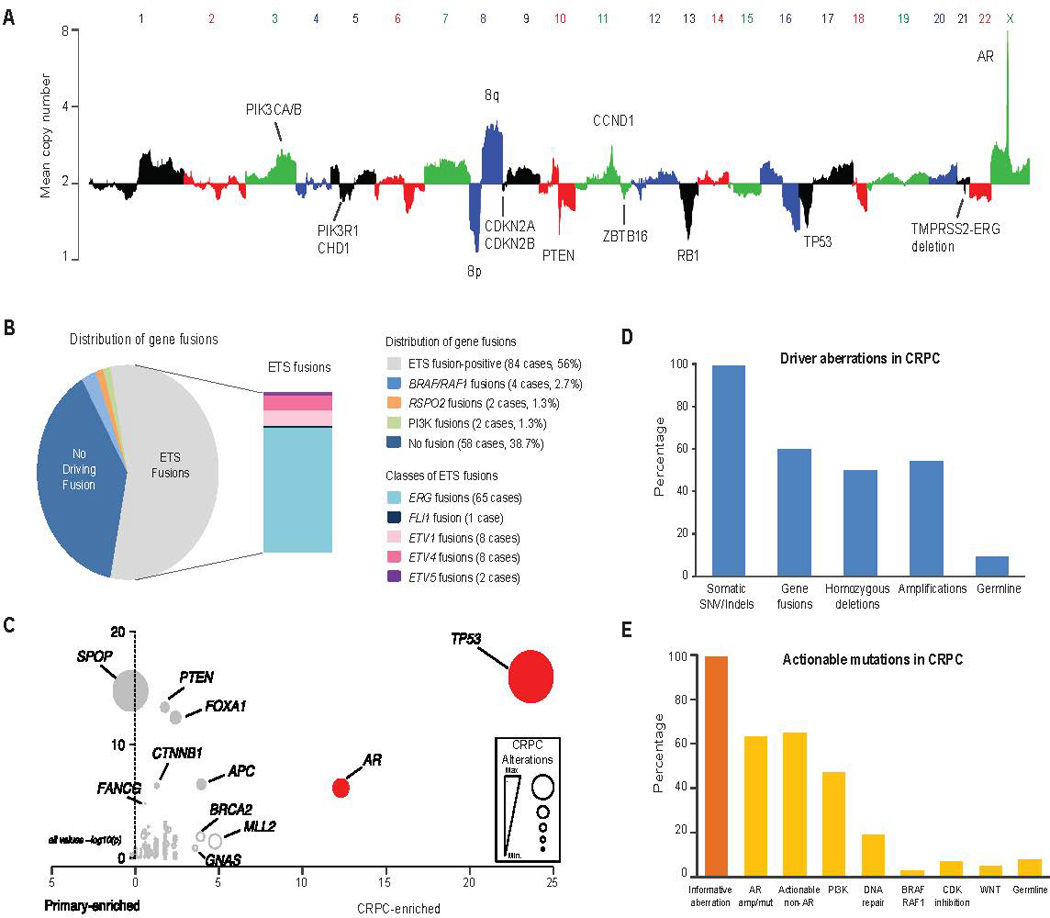
Figure 3. Classes of genomic aberrations seen in mCPRC.

A, Copy number landscape of the SU2C-PCF mCRPC cohort. Individual chromosomes are represented by alternating colors and key aberrant genes are indicated. B, The gene fusion landscape of mCRPC. Pie chart of all driver fusions identified and the box plot represents specific ETS fusions. C, Mutations enriched in mCRPC relative to hormone naïve primary prostate cancer. Primary prostate cancer data derived from published studies (Barbieri et al., 2012) (TCGA, Provisional 2015). Level of CRPC enrichment represented by the×axis and MutSig CRPC significance analysis provided by the y axis. Diameters are proportional to the number of cases with the specific aberration. Genes of interest are highlighted. D, Classes of driver aberrations identified in mCRPC. E, Classes of clinically actionable mutations identified in mCRPC.
