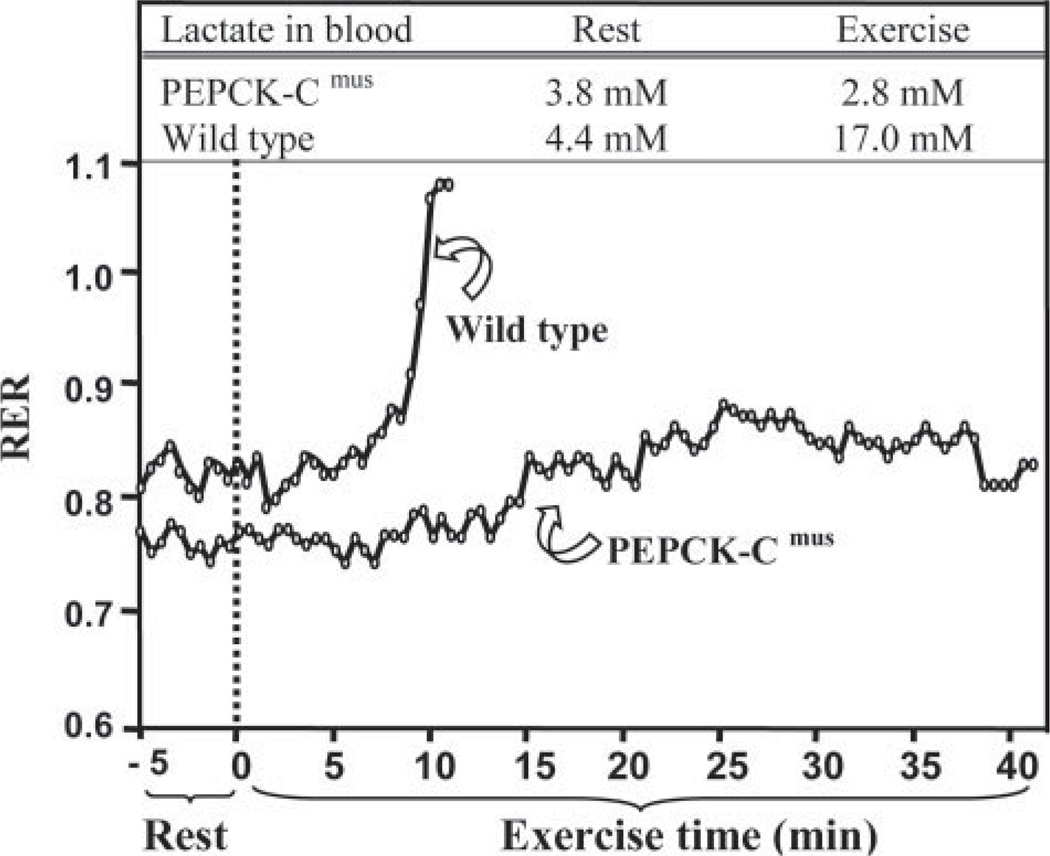
FIGURE 4. A graphical plot of fuel utilization by a PEPCK-Cmus and control mouse during strenuous exercise.
This figure is a graphical plot of the alterations in the RER of an untrained PEPCK-Cmus mouse and a control animal. The data are drawn from a larger group of PEPCK-Cmus mice (n= 9) and control littermates (n= 10) that is presented in Table 3. The RER was assessed using a speed-ramped treadmill entirely enclosed in an environmental chamber and equipped to measure changes in oxygen consumption and carbon dioxide output. The mice were acclimated to the chamber for 60 min, after which the speed of the treadmill (set at a 25° slope) was set at 10 m/min and for 30 min and then increased 2 m/min every 2 min until the mice reached exhaustion (see the second protocol described under “Experimental Procedures”). A blood sample was taken before and after exercise for the measurement of lactate. Both the rate of oxygen consumption and the rate of carbon dioxide generation by the mice were monitored continuously throughout the exercise period.

