
Fig. 3.
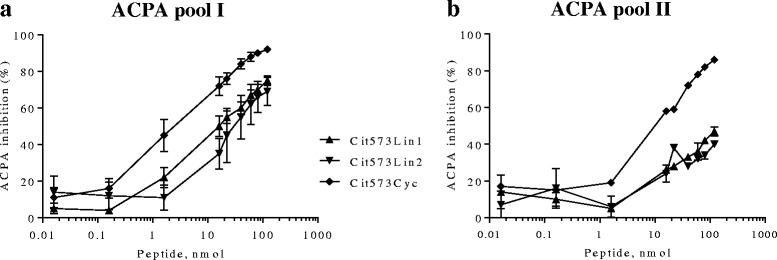
Dose-response curves representing the percentage of ACPA targeted by fibrinogen 573-derived peptides. ACPA was incubated at different concentrations of the respective peptide for one hour at room temperature before proceeding with the anti-CCP2 ELISA. a. ACPA (pool I) blocking with the Cit573 peptide, with the Cit573 truncated or cyclic forms or with the unmodified arginine-containing 573 peptide as control. b. Corresponding experiment as in (a) but using ACPA pool II. X-axes show peptide amount (nmol). Y-axes show ACPA inhibition percentage levels (%). Circles represent means of two to seven experiments per ACPA pool