
Fig. 2.
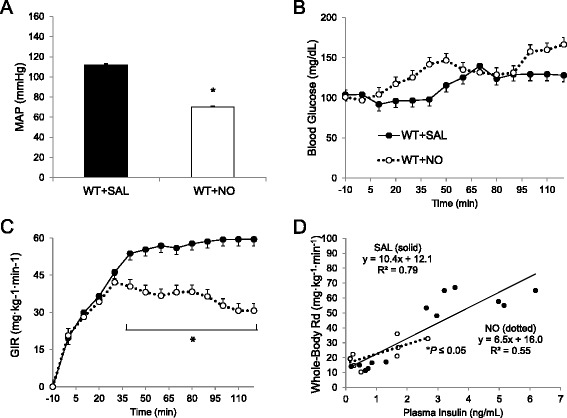
Mean arterial blood pressure (MAP in mmHg, Panel a), blood glucose (mg/dL, Panel b) and glucose infusion rate (GIR in mg · kg−1 · min−1, Panel c), for saline-treated (SAL) or sodium nitroprusside (NO)-treated wild-type (WT) mice during a hyperinsulinemic-euglycemic clamp (Group 1A). Mice were treated with NO 90 min prior to clamp onset (t = 0 min). Glucose (50 %) was infused to maintain euglycemia at 120 mg/dL during steady state (t = 80–120 min). Insulin sensitivity was assessed as rate of whole body glucose turnover (Rg) per animal plasma insulin level (d). Data are expressed as mean ± SEM (n = 4–7). *p < 0.05 vs. WT + SAL. Comparison of MAP (30–120 min) and GIR (80–120 min) were assessed via t-test