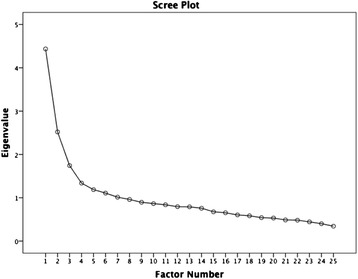
Fig. 3.

Scree plot of eigenvalues derived from exploratory factor analysis of the correlation matrix for 25 items of the 18-month Q-CHAT

Scree plot of eigenvalues derived from exploratory factor analysis of the correlation matrix for 25 items of the 18-month Q-CHAT