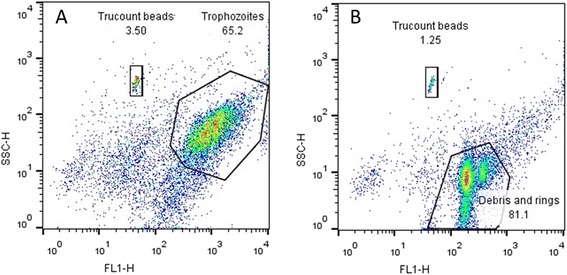
Fig. 1.

Dot plots displaying isolated Plasmodium falciparum cells corresponding to trophozoites (a) and rings and cell debris (b) after staining with the fluorescent DNA dye, SYBR green I and the populations corresponding to fluorescent Trucount beads
