
Fig. 6.
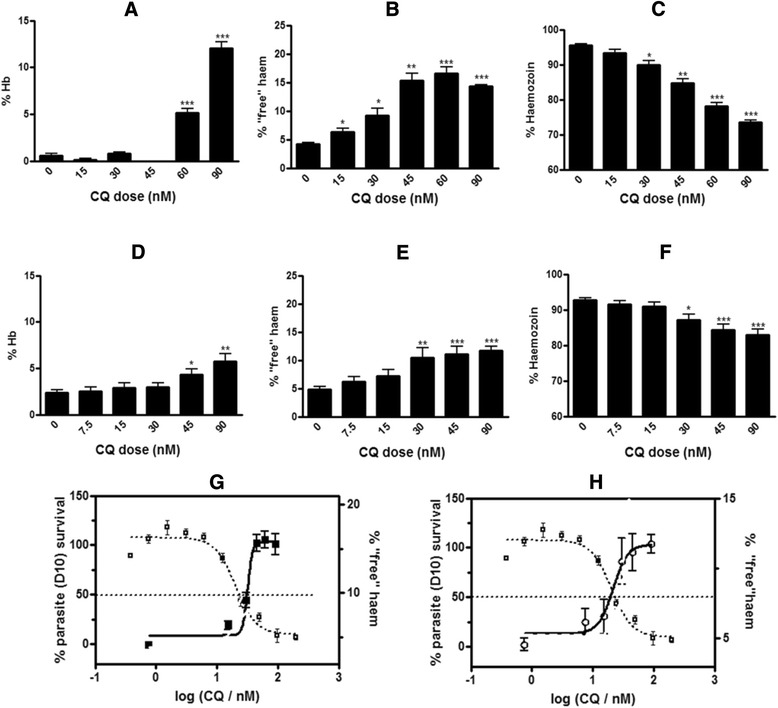
Percentage of haem species found in chloroquine-treated trophozoites assayed with the original flask method (a, b, c and g) and the new plate method (d, e, f and h) Hb (a, d), ‘free’ haem (b, e) and Hz (c, f) at increasing concentrations of CQ are expressed as a percentage of the total haem found in isolated trophozoites. Statistical significance, calculated using a two-tailed t-test (error bars showing 95 % CI) is expressed relative to the control using asterisks. The parasite survival curve (left axis) was determined using the parasite lactate dehydrogenase assay [22] and is overlaid with the percentage of ‘free’ haem (right axis) determined by both the original flask method (g) and new plate method (h) as a function of CQ concentration. Plots are scaled so that the dotted line in this and subsequent figures corresponds to both the parasite growth inhibition IC50 as determined by the parasite lactate dehydrogenase assay and the midpoint of the ‘free’ haem increase determined using the haem fractionation assay. CQ IC50 in D10 = 19.2 ± 4.2 nM