
Fig. 8.
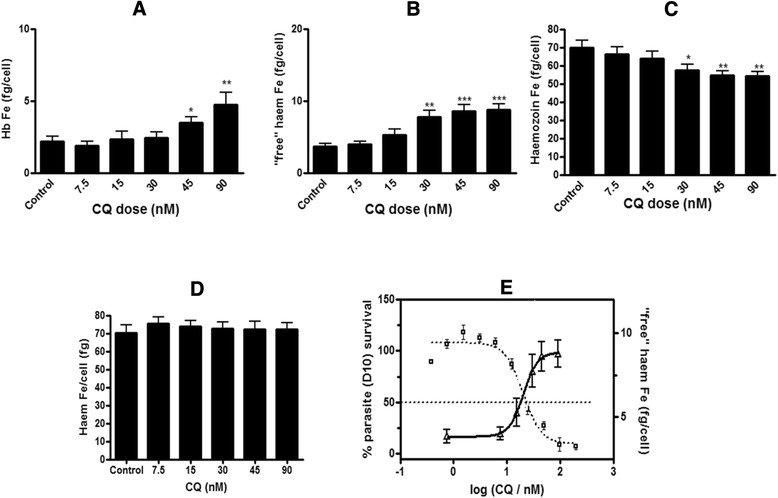
Amount of haem Fe per cell (fg) found in chloroquine-treated trophozoites (plate method). Hb (a), ‘free’ haem (b) and Hz (c) at increasing concentrations of CQ expressed as total amount of haem Fe per isolated trophozoite (fg/cell). Total haem Fe per cell in the control was not statistically different to untreated cells (d). Statistical significance, calculated using a two-tailed t-test (error bars showing 95 % CI) is expressed relative to the control using asterisks. The parasite survival curve was determined using the parasite lactate dehydrogenase assay [22] and is overlaid with the total amount of ‘free’ haem Fe per isolated trophozoite as a function of CQ concentration (e). CQ IC50 in D10 = 19.2 ± 4.2 nM