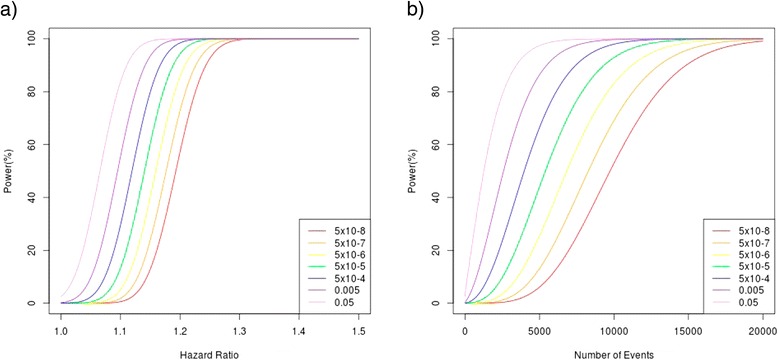
Figure 2.

Power (%) to detect true associations with survival time across a range of minor allele frequencies and numbers of events. (a) Power (%) to detect true associations with survival time over a range of effect sizes at increasing orders of significance given a minor allele frequency of 0.3 and 2,900 events. We used an imputation r2 = 0.8 to account for suboptimal imputation. (b) Power (%) to detect true associations with survival time for increasing numbers of events, at increasing orders of significance, given a minor allele frequency of 0.3 and an effect size of 1.1. We used an imputation r2 = 0.8 to account for suboptimal imputation.
