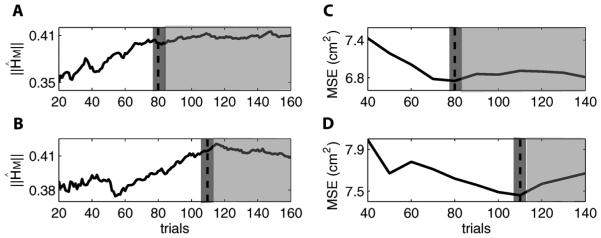
Fig. 3.

(a) Solid line is the estimated in the Kalman filter model as a function of number of training trials in dataset 1. White area denotes the first varying period when more data are needed to fit the parameters in the model. Light gray area denotes the second varying period when training data are sufficient yet nonstationary over time. Dashed line and dark gray area denote the transition region. (b) Same as (a) except for dataset 2. (c) Solid line is MSE in the adaptive Kalman filter decoding as a function of number of training trials in dataset 1. This function approximately decreases in the white area and then levels off around the dashed line and dark gray area. (d) Same as (c) except for dataset 2.
