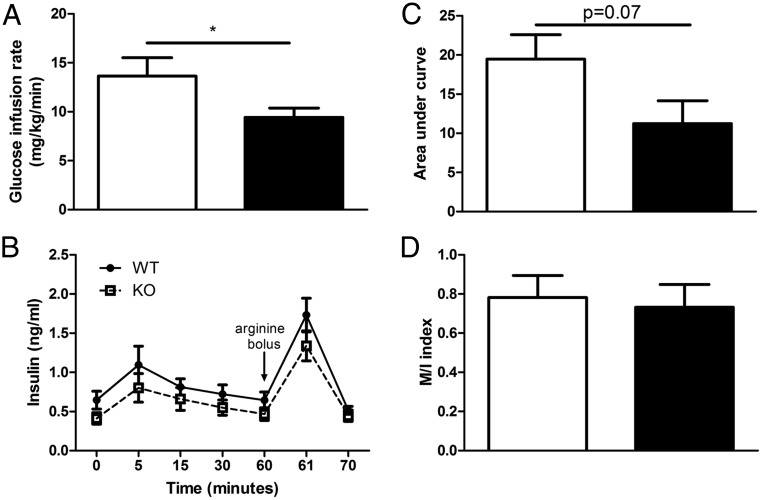
Figure 2.
Ffar2−/− mice exhibit trend toward decreased insulin secretion during hyperglycemic clamp. GIR (A) and insulin secretion (B) during 1-hour hyperglycemic clamp in WT and Ffar2−/− male mice maintained on NC diet (WT, n = 8; Ffar2−/−, n = 9). C, Insulin area under the curve (AUC) during hyperglycemic clamp studies. D, Insulin sensitivity index (M/I index) calculated by GIR (M) divided by the average 30- to 60-minute insulinemia (I). *, P < .05. For B, circles represent WT, squares represent Ffar2−/−. For A, C, and D, white bars represent WT, black bars represent Ffar2−/−.

