Figure 2.
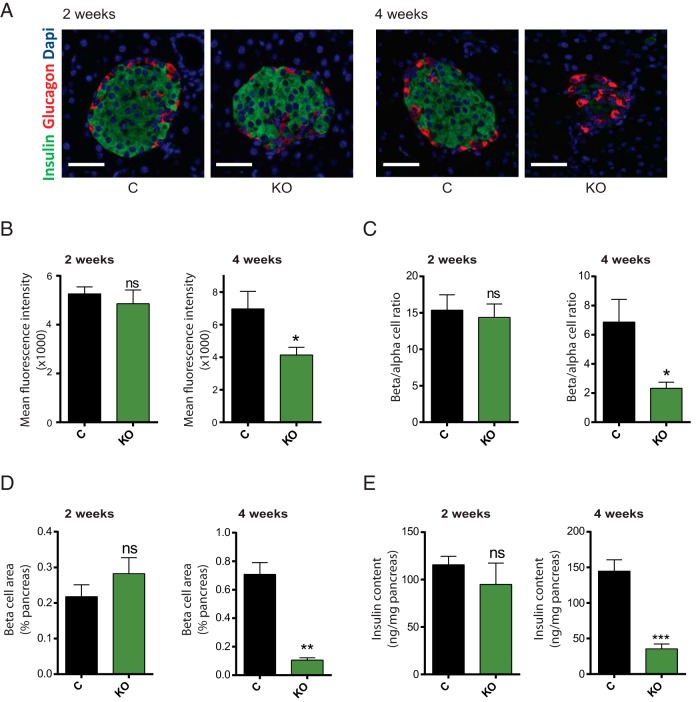
β-Cell mass and insulin content are reduced in βDicer-null islets. Pancreata from βDicer-null (KO) or littermate controls (C), 2 or 4 weeks after tamoxifen administration, were fixed and subjected to immunocytochemical analysis for insulin and glucagon, as indicated. A, representative islets. Dapi, 4′,6-diamidino-2-phenylindole. B, To estimate islet insulin content, ImageJ software was used to quantify fluorescence intensity of insulin staining (per insulin positive surface). C, β- and α-cell masses are presented as the β-cell/α-cell ratio and correspond to quantification of insulin-positive area/glucagon positive area ratio. D, β-Cell mass is presented as a percentage of the pancreatic surface and corresponds to quantification of the insulin-positive area per pancreas area quantified in whole pancreas sections. n = 3 mice/genotype; 5 pancreas sections per animal were used, evenly separated by 25 μm. Scale bar corresponds to 40 μm. E, Pancreatic insulin was extracted from whole pancreas in acidic ethanol and measured using an HTRF insulin assay (n = 3–6 mice/genotype). *, P < .05; **, P < .01; ***, P < .001, Student's t test; ns, not significant.

