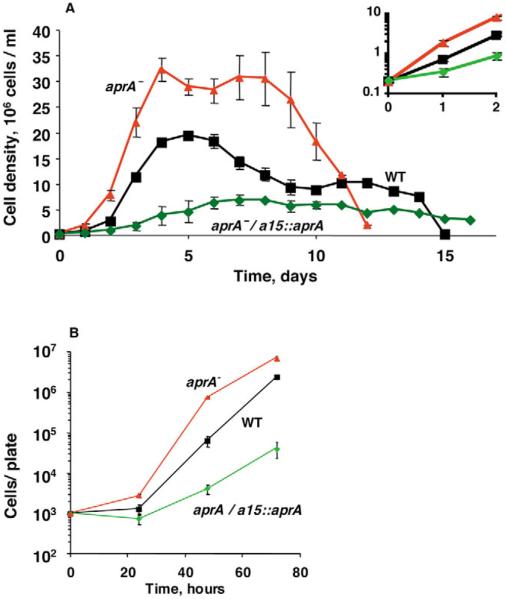
Fig. 7.
AprA slows the proliferation of cells. (A) Cells were diluted to 2×10⁵ cells/ml in HL5 and the cell density was measured daily. The graph shows means±s.e.m. from three independent experiments. WT indicates wild type. The insert shows the data from the first two days plotted using a log scale for the density. The saturation densities (in units of 107 cells/ml) were 3.24±0.06 for aprA−, 1.94±0.07 for wild type and 0.69±0.10 for aprA−/actin15∷aprA. The differences between the wild-type saturation density and either the aprA− or the aprA−/actin15∷aprA saturation density were significant (P<0.01; one-way ANOVA; Dunnett's test). (B) For each cell type, three 100 mm petri dishes with SM/5 agar were spread with a lawn of bacteria mixed with 1000 Dictyostelium cells. At the indicated times, the bacteria and cells were washed off one of the plates, and the Dictyostelium cells were counted. The graph shows means±s.e.m. from three independent experiments. At 72 hours, the difference between wild type and aprA−/actin15∷aprA was significant (P<0.05) and the difference between wild type and aprA− was significant (P<0.01; one-way ANOVA, Dunnett's test). The absence of error bars indicates the error was smaller than the plot symbol.

