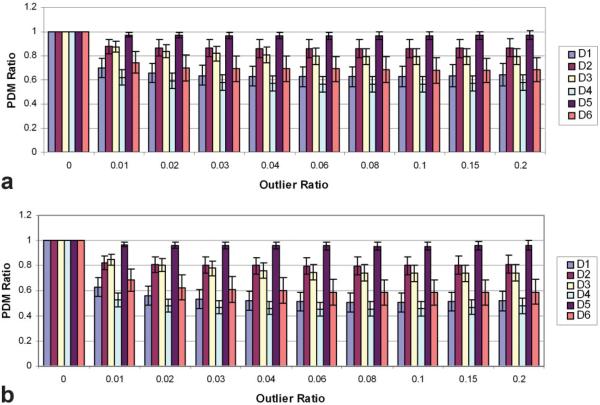
Figure 5.
PDM ratios with (a) and without (b) center filling. The PDM ratio is the PDM score with Robust GRAPPA divided by the PDM with regular GRAPPA. Each datum point in the figure represents the average PDM ratio over 90 images (15 different TRFs and 6 levels of noise). Error bars correspond to one standard deviation. Robust GRAPPA generally outperformed regular GRAPPA for both center-filling options.

