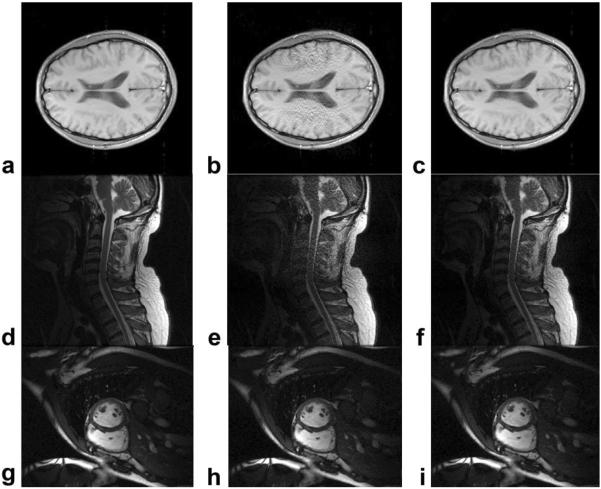
Figure 6.
The image quality comparisons between the Regular GRAPPA (second column) and Robust GRAPPA (third column) for dataset D1 (first row), D2 (second row), and D5 (third row). Images reconstructed with full k-space were provided as references (first column). No noise was added, and all images were with center filling. Total reduction factor was 2.2 with the reduction factor of 3. For Robust GRAPPA reconstruction, outlier ratio was set as 0.08.

