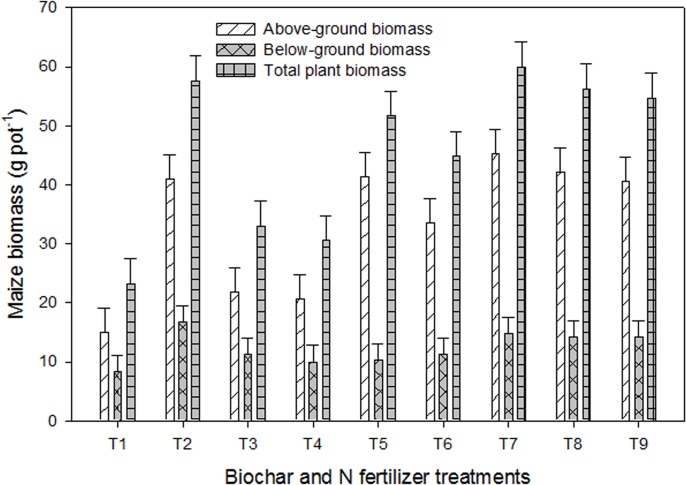
Fig 1. Maize biomass production in response to the application of biochars with and without N fertilizer under greenhouse conditions.
Treatments included i.e. T1 = control, T2 = urea N (UN) at 200 mg kg-1, T3 = urea N (UN) at 100 mg kg-1, T4 = white clover residue biochar (WCRB) at 30 t ha-1, T5 = poultry manure biochar (PMB) at 30 t ha-1, T6 = WCRB+PMB (50:50 w/w), T7 = UN+WCRB (50:50 w/w), T8 = UN+PMB (50:50 w/w), and T9 = UN+WCRB+PMB (50:25:25 w/w). The vertical lines on each bar represent the least significant difference (LSD at P ≤ 0.05) among different treatments for each trait while the letters on each bar highlight the statistical differences among the treatments for the traits studied.

