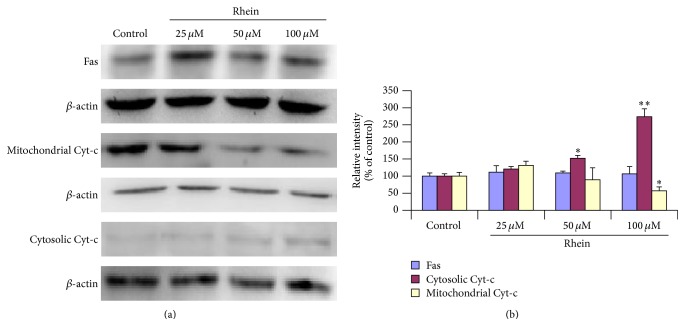
Figure 11.
Western blot analysis of Fas and mitochondrial/cytosolic Cytochrome-c protein expression levels in HL-7702 cells exposed to different doses of rhein. (a) Representative results of western blotting analysis. β-actin served as a loading control. (b) The quantification of the immunoblots was analyzed by densitometric scanning. Band densities were digitized and relative band intensities of target proteins were normalized against the β-actin levels. Data were expressed as mean ± SD from three different experiments, ∗ P < 0.05, ∗∗ P < 0.01, significantly different from control values.

