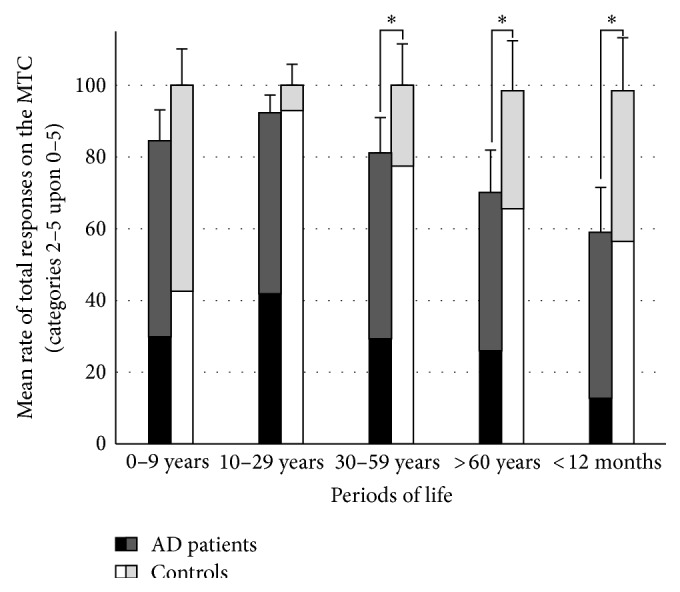
Figure 2.

Mean and standard deviation for the rates of total responses (number of memories scored (2 to 5)/30) on the MCT for AD patients and healthy controls in the five periods of life (*significant intergroup comparison after post hoc analysis). The rates of specific (scored 4 and 5) and general responses (scored 2 and 3) among the total responses are indicated in black and dark gray for the AD patients, and in white and light gray for the controls, respectively.
