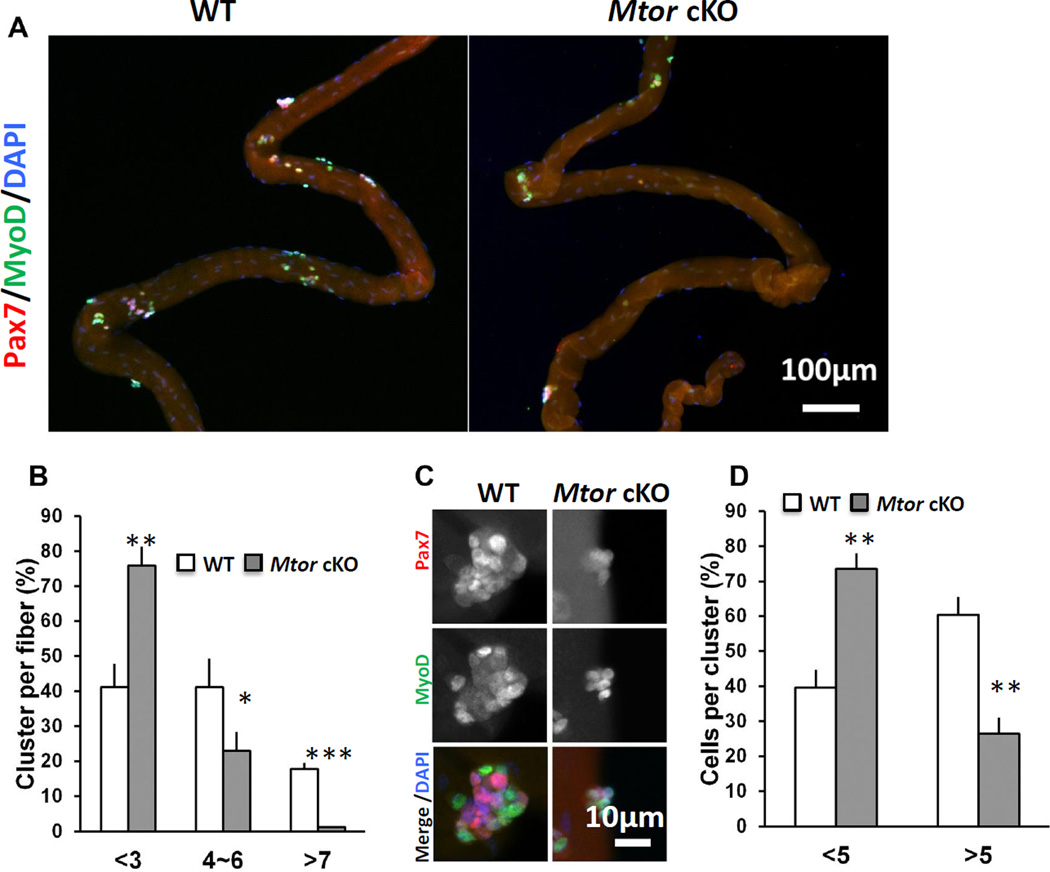
Figure 2. Single myofiber analysis of WT and Mtor cKO EDL muscles.
(A) Representative images of single EDL myofibers cultured for 72 h. Myoblasts were labeled with Pax7 (red) and MyoD (green). (B) Abundance of satellite cell-derived myoblast clusters grown on EDL myofibers after cultured for 72 h. n = 4 pairs of mice, 20 myofibers from each mouse were analyzed. (C) Representative images of clusters of myoblasts labeled with Pax7 (red) and MyoD (green) after grown for 72 h. (D) Relative abundance of large (containing >5 myoblasts) and small (containing 5 or less myoblasts) clusters grown on cultured EDL myofibers of Mtor cKO and WT mice. n=4 pairs of mice, 50 clusters for each mouse. * p < 0.05, ** p < 0.01, *** p < 0.001.

