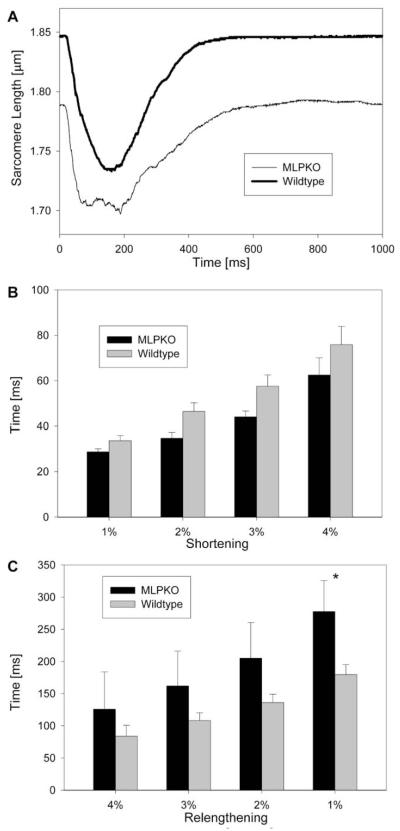
Fig. 1.
(A) Average time-course of shortening from unloaded length in both genotypes. (B) Time to different amounts of shortening expressed as percent shortening, and (C) time to different amounts of relengthening from peak shortening in MLPKO and wildtype muscles. The asterisk indicates a significant difference (P < 0.05) between the genotypes.

