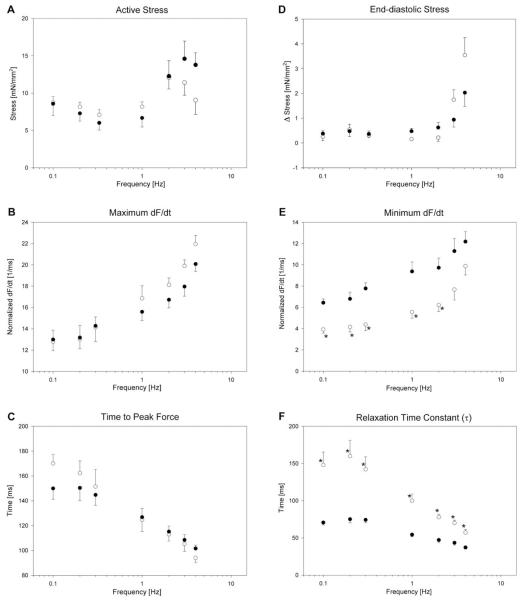
Fig. 2.
Systolic (A–C) and diastolic (D–F) behavior of MLPKO (○) and wildtype trabeculae (●) at a passive sarcomere length of 2.00 μm over the entire range of frequencies tested. (A) Absolute active developed stress. (B) Maximum dF/dt (maximum rate of force development), normalized by peak force. (C) Time from stimulus to peak force. (D) Diastolic stress (difference from minimum stress of all frequencies). (E) Minimum dF/dt (maximum rate of relaxation), normalized by peak force. (F) Relaxation time constant τ, computed from a fitted exponential to the relaxation time-course after the inflection point. The asterisks denote significant differences (P < 0.05) between the genotype groups.

