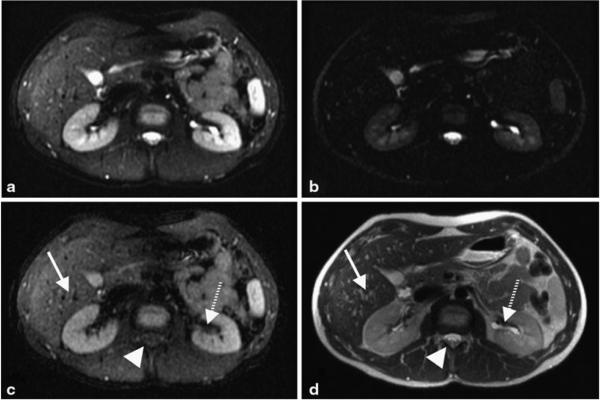
Fig. 3.
Shorter TE image (a), longer TE image (b), and the subtracted iSTIR image (c) of a normal volunteer. Compared to the standard SSFSE image (d), the iSTIR image shows uniform fat suppression, reduced signal intensity from the blood vessels (e.g., in the liver, arrow) and reduced fluid signal (e.g., in CSF, arrowhead and collecting system in the kidneys, dashed arrow)

