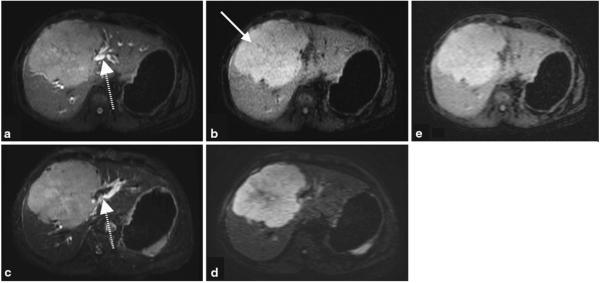
Fig. 6.
Shorter TE image (a) and the subtracted iSTIR image (b) of a patient with a large central liver mass (arrow), compared against fat-suppressed T2-weighted image (c) and a diffusion-weighted image (b = 500 s/mm2) (d). Shorter TE image (a) resembles the fat suppressed T2-weighted image (c), while the subtracted iSTIR image (b) qualitatively resembles the diffusion-weighted image (d). When reconstructed to the same spatial resolution as DWI, iSTIR image (e) provides equivalent contrast to noise ratio of DWI. The dashed arrow represents the biliary ducts that are visible on the shorter TE image (a) similar to the fat-suppressed T2-weighted image (c). The final diagnosis of the tumor is aggressive poorly differentiated primary neuroendocrine cell carcinoma of the liver

