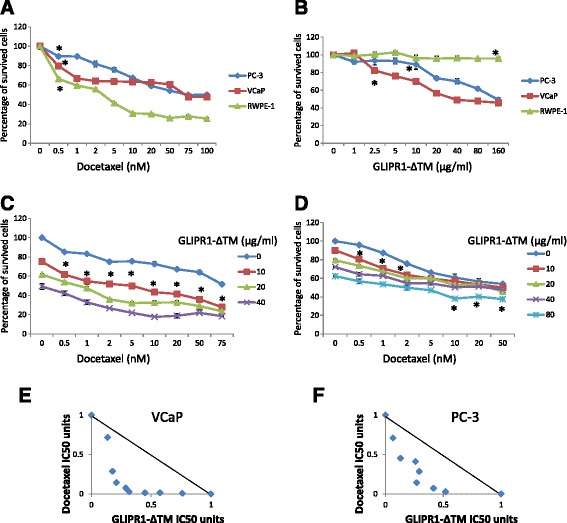
Fig. 1.

GLIPR1-ΔTM reduced VCaP and PC-3 cells’ survival synergistically with docetaxel. a. Docetaxel dose–response curves of VCaP, PC-3, and RWPE-1 cells treated for 48 h, determined using MTS assay. At 0.5nM, docetaxel significantly decreased cell survival in the three cell lines. The IC50 was 69.8nM for VCaP cells and 70.5nM for PC-3 cells. b. GLIPR1-ΔTM dose–response curves of VCaP, PC-3, and RWPE-1 cells treated for 48 h, determined using MTS assay. At 2.5 μg/ml and 10 μg/ml, GLIPR1-ΔTM significantly decreased survival of VCaP and PC-3 cells, respectively. Only 160 μg/ml decreased survival of RWPE-1 cells. The IC50 was 34.8 μg/ml for VCaP cells and 154 μg/ml for PC-3 cells. c. The addition of 10 μg/ml GLIPR1-ΔTM increased the efficacies of all doses of docetaxel in inhibiting VCaP cells’ survival, based on MTS assay. d. The addition of 10 μg/ml GLIPR1-ΔTM increased the efficacies of 0.5, 1, and 2nM docetaxel in inhibiting PC-3 cells’ survival as determined by MTS assay, and the addition of 80 μg/ml GLIPR1-ΔTM increased the efficacies of 10, 20, and 50nM docetaxel. e. Isobologram analysis showed that GLIPR1-ΔTM and docetaxel synergistically induced cell death in VCaP cells. f. Isobologram analysis showed that GLIPR1-ΔTM and docetaxel induced cell death synergistically in PC-3 cells. The results are presented as the mean ± standard error from at least three independent experiments
