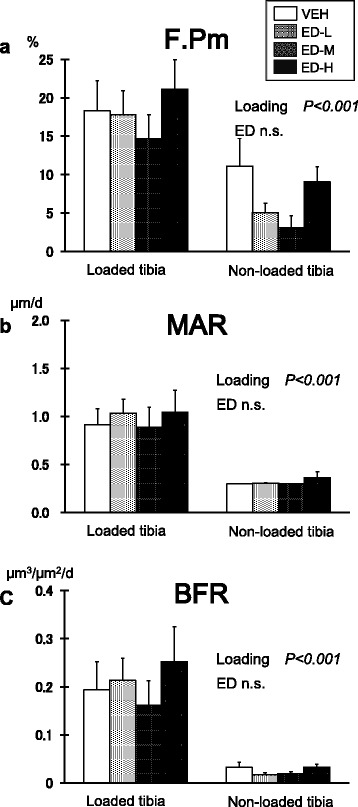
Fig. 3.

Bone response at the lateral periosteal surface. (a) Formation perimeter (F.Pm); (b) mineral apposition rate (MAR); (c) bone formation rate (BFR). There were significant differences between the loaded and non-loaded sites in all three parameters by repeated two-way analysis of variance (P < 0.001). F.Pm and BFR in the high-dose eldecalcitol group were highest among the four groups at the loaded tibiae; however, the differences with the vehicle group were not significant compared by Dunnett’s test. Data are mean ± SEM. ED-H: high dose eldecalcitol; ED-M: medium dose eldecalcitol, ED-L; low dose eldecalcitol; VEH: vehicle
