
Fig. 1.
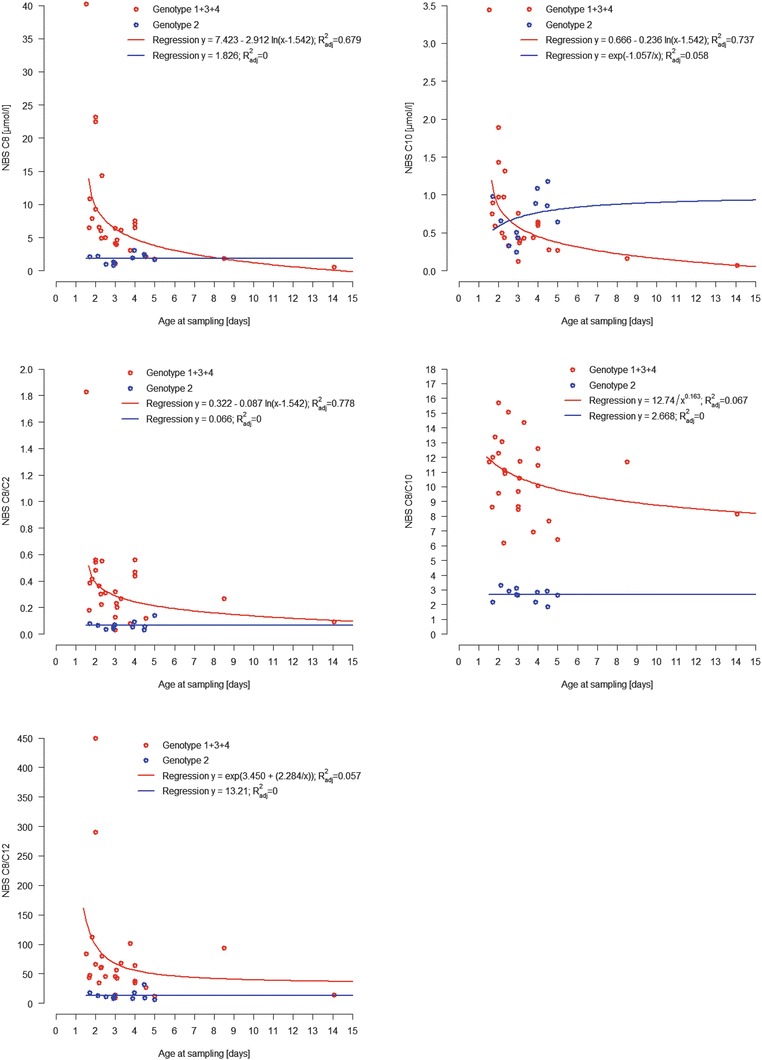
Biochemical parameters at first screening in relation to age at sampling in genotype groups 1 + 3 + 4 and 2. Regression equations and regression models for nonlinear curve fitting are shown for C8 (logarithmic and linear model), C10 (logarithmic and S-model), C8/C2 (logarithmic and linear model), C8/C10 (hyperbolic and linear model) and C8/C12 (S-model and linear model)